

Market intelligence · November 2025
Automotive Search: The 2025 Market Intelligence Report
The 2025 Market Intelligence Report
If you want to understand where demand is going, and why it’s shifting, search remains the most honest signal in the market.
Introduction
Search Volume is the Most Honest Signal in the Market
Introduction · Page 04
Search Volume is the Most Honest Signal in the Market
The UK automotive sector isn’t short on data. From SMMT registration figures to marketplace dashboards and economic forecasts, there’s no lack of visibility. But if you want to understand where demand is going, and why it’s shifting, search remains the most honest signal in the market.
It reflects real, self-directed behaviour. It cuts across brand loyalty, budget, fuel type, and channel preference. And in 2025, it increasingly mirrors the pressures, uncertainties, and trade-offs facing today’s car buyer, from interest rate volatility to ZEV mandates and AI-driven discovery.
This report is based on real performance data, not hypotheticals. We’ve drawn on search volumes, organic traffic shifts, CPC trends and domain-level activity to reveal the stories that matter.
TLDR
In 2025, the story it tells is clear
- 01Used car demand has rebounded sharply
Search demand for ‘used cars’ was up by approximately 30% year-on-year in August 2025, a sharp rebound following a sluggish first half, driven by affordability pressures and increasingly digital-first buying behaviour.
- 02Leasing is showing signs of recovery after a 3-year slump
Not just as a finance option, but as a risk-averse way to access new EV tech.
- 03Finance queries are growing
But they are increasingly shaped by reputational scrutiny and the fallout from mis-selling headlines.
- 04New car searches are rising modestly
Led by brand-specific intent, not generics.
- 05EV interest remains resilient, but volatile
A sign of curiosity outpacing confidence.
The backdrop
05All of this is playing out against a backdrop of major structural change
- ZEV mandates, BIK incentives, and salary sacrifice schemes reshaping purchase models
- Public scrutiny on finance and residual values
- Infrastructure gaps slowing down EV readiness
- Cost-of-living pressure making flexibility more valuable than ownership
- LLMs and AI Overviews beginning to divert attention away from traditional search journeys
- And a search landscape where the average brand now competes with 7 others on the same page (Source - Google)
Page 06
This Is Not Just a Search Report
This isn’t just a list of keywords, it’s a reflection of why behaviour is shifting, and what brands need to do to respond.
We’ve paired search insights with deeper PESTLE analysis (Political, Economic, Social, Technological, Legal, and Environmental), understanding how these forces are shaping the commercial realities behind the search box.
The result is a layered picture: one that connects macroeconomic signals, consumer confidence, brand visibility, and channel fragmentation to the actual behaviours showing up in real-time search activity.
We focus on four key verticals
- Used Cars
- New Cars
- Car Finance
- Leasing
Industry-leading tools
To build this report, we analysed search behaviour using a range of industry-leading tools including Ahrefs, Sistrix, Similarweb & Moz. These platforms allow us to track keyword trends, traffic shifts, channel splits, and competitive visibility across thousands of domains and millions of queries.
EVs get their own report
We’ve also chosen to separate out Electric Vehicles into a standalone report, a category whose complexity, volatility and strategic importance warrants its own deep dive.
Who This Is For
This report is written for leaders in:
- OEM marketing & strategy teams
- Leasing, fleet & mobility providers
- Digital marketplaces & aggregators
- Automotive finance brands & lenders
- Dealer groups, retail networks & commercial boards
If you’re making decisions about channel mix, product strategy, digital experience, or brand position, this is built for you.
If you just want to know what the latest Search Marketing developments are within automotive, we’ve provided a TLDR (Too Long, Didn’t Read) at the end for you!
Why UpShift is leading this conversation
Here’s how
We work with brands across the automotive ecosystem, from marketplaces and leasing platforms to OEMs and finance providers to solve the real-world challenges that search exposes. Whether it’s falling rankings, overreliance on paid media, or aggressive competition from established players, we help brands cut through the noise and grow sustainably, measurably, and profitably.
Make sense of fragmented or volatile search data
We turn shifting demand signals, across EVs, leasing, finance and used cars, into actionable insight for teams across performance, brand, and commercial.
Translate search behaviour into commercially actionable strategy
Visibility is just the starting point. We focus on outcomes: increasing units sold, improving ROI, and protecting margin across organic and paid channels.
Build full-funnel strategies that blend performance and positioning
From first click to final conversion, we help brands show up where it matters, and say something worth remembering when they do.
Strengthen brand clarity in competitive or commoditised categories
In aggregator-heavy spaces where everyone looks and sounds the same, we build standout, helping brands own their niche and outperform on commercial metrics.
Diagnose bottlenecks and unlock new routes to growth
Whether it’s a sudden rankings drop, creeping CPA, or stalled visibility, we identify where performance is stuck and what needs to change.
Market overview
The State of Automotive Search
The State of Automotive Search
09A way to read the mood of the market
Search has always been a useful signal of demand. But in 2025, it has become something more: a way to read the mood of the market.
Search activity reflects what people are thinking about, what they’re weighing up, and what they can afford to act on. It’s a live, unfiltered look at how intent is shifting across the automotive space.
We’ve seen that growth is happening, but not everywhere, and not for everyone. Some categories are rebounding, others are flat. Some spikes in search are driven by consumer demand; others by regulatory news cycles or commercial pressure. Understanding the difference matters.
This section looks at the wider context of automotive search in the UK: how it’s evolving, what’s driving the change, and what brands need to be aware of before we dive into specific category performance.
Automotive-related search activity year-on-year in the UK
Google, 2025Other brands the average brand now competes with in the same search journey
Google, 2025Nearly double the level of competition seen in 2021
Google, 2025Page 10
Search Volume is Rising, But So is the Fight for Visibility
Overall automotive-related search activity is up +11% year-on-year in the UK (Google, 2025). That’s a healthy signal, people are still actively researching and exploring.
But that interest is now spread more thinly. The average brand is competing with seven others (Google, 2025) in the same search journey, nearly double the level seen in 2021. Marketplaces, leasing aggregators and brokers, finance providers, content publishers, and OEMs are all contending for the same attention.
Being visible is no longer just about technical optimisation or media spend. It’s about positioning clearly within a more crowded, fast-moving ecosystem.
The Journey is More Fragmented and More Omnichannel Than Ever
Search used to sit near the top of the funnel. Today, it’s everywhere.
Consumers use it to compare finance, check delivery options, find dealerships, value their old car, and decide between leasing and buying. In fact, according to Google, Automotive is the most omnichannel of all sectors!
of new car buyers say they identified their desired model online
Google · page 11of buyers who watched automotive video content took a follow-up action
Google · page 11…only 14% completed their purchase entirely online
Google · page 11People still want to test drive, speak to someone, and experience the car, but the decisions leading up to that point are often shaped digitally, long before they reach a forecourt.
Page 12
Consumers Are Looking for Clarity, Control, and Confidence
Search trends in 2025 show a tilt towards value, simplicity, and flexibility. These aren’t passive browsing behaviours, they’re signs of people trying to make good decisions under pressure.
Used car searches are rising
A tilt towards value as household budgets stay under pressure.
Leasing is growing fast
Finally rebounding from a slump which began in 2022.
Niche, needs-led queries are growing significantly
Queries like “EV salary sacrifice” or “bad credit car finance” are growing significantly.
Meanwhile, only 26% of women say car ads feel relevant to them (Google, 2024).
Page 13
Aggregators Are Reshaping Discovery
Marketplaces and aggregators, Auto Trader, Motorway, Carwow, Leasing.com and others are increasingly shaping how people begin their car buying journey.
These platforms aren’t just winning traffic. They’re shaping perception. Their UX, filters, reviews, and search tools are setting expectations for how easy it should be to research and compare.
For many buyers, the aggregator is the brand. Or at least, the first brand they interact with.
Brand Still Matters, But it’s Easier to Lose
Brand searches remain strong, and in some categories, particularly EVs, fleet, and finance, they’re still growing. These are high-stakes decisions, where trust, clarity, and perceived risk all elevate the role of brand.
But brand strength is more fragile now. If your finance page is unclear, your lease terms are buried, or your reviews are inconsistent, people move on. Quickly. There are too many alternatives, and too many platforms that feel easier to navigate.
Google noted in its 2024 Automotive Roundtable that “brand differentiation is more important than ever.” We agree, but not just in the traditional sense. It’s no longer about slogans or ad spend. It’s about being clearer, earlier, and more useful than the competition in the places where consumers are actively making decisions.
For example, when a consumer searches “EV lease under £300 with home charger,” the brands that show up with transparent pricing, eligibility filters, and helpful ownership content are differentiating, not just by being present, but by removing friction. In that moment, clarity outperforms cleverness. And the brand that answers the question best often becomes the one that wins the click, the trust, and the sale.
Visibility still matters, but quick clarity and distinction are what convert.
Page 15
Large Language Models Are Playing a Role In Discovery
Large Language Models (LLMs) like ChatGPT, Google Gemini, and others are changing how consumers research.
They’re helping people narrow down choices, understand finance options, and compare models, often before they even reach a search engine. These questions are increasingly being asked in natural language, through AI tools.
To be clear, Google Search still dominates. In late 2024, searches on Google outnumbered ChatGPT prompts by a ratio of 400 to 1. But the direction of travel is important. These tools are starting to influence how people build shortlists and where they place trust.
LLMs often pull from trusted public sources like Reddit, high-authority publisher content, automotive specific forums, and structured data feeds. That means brands can’t rely solely on their own website or ads to shape perception.
Questions like
- “What are the best EVs under £300 a month?”
- “What cars are eligible for salary sacrifice in the UK?”
- “Is leasing or PCP better right now?”
Strategic implications
- Optimise your site for clarity and structure, AI tools favour well-organised, readable content
- Ensure your product feeds (e.g. for Google Vehicle Ads) are accurate, up to date, and informative
- Influence the third-party sources that LLMs pull from: Reddit, forums, review sites, aggregators
- Every SEO strategy should be factoring LLMs right now: AI summaries may become the first impression before search even begins
Page 16
What This Tells Us
Search demand is growing, but so is complexity. The journey has become fragmented, crowded, and harder to measure.
Consumers are using search, aggregators, finance tools, and AI assistants to narrow options and build confidence. Brand preference can be shaped long before a visit to your site, or even a Google query.
Meanwhile, measurement is becoming less precise. Cookie loss, channel and device switching, and off-platform behaviour are making attribution less reliable. LLMs add a new layer of opacity.
In the next sections, we’ll look at how these dynamics are playing out across four core categories: Used Cars, New Cars, Car Finance and Leasing.
Used Cars
Market Context
Used Cars · Page 17
Used Cars: Market Context
The UK used car market between 2023 and 2025 has been shaped by an unusual mix of volatility, resilience, and recovery.
After a period of elevated demand in 2021–2022 (driven by pandemic-era supply shortages), search interest began a sustained decline from early 2023 through to mid-2024. This was no seasonal dip, it was a reflection of real-world pressure on household budgets.
From January 2023 to May 2024, UK inflation remained sticky, interest rates peaked above 5%, and consumers increasingly delayed major financial decisions. Search volumes mirrored this behaviour: intent-led keywords like “used cars”, “cars for sale”, and “cars for sale near me” all saw consistent declines year-on-year.
By early 2024, average used car prices had begun to stabilise, but that didn’t immediately bring buyers back. It wasn’t until the Bank of England cut interest rates in May and again in August 2025 that consumer confidence showed meaningful signs of returning.
Page 18 · Search Trend Highlights
Across all intent stages, discovery, browsing, and local dealership, the search data tells a consistent story
Three phases from decline to rebound.
- 01
2023–2024
A 15–20% drop in total search interest
A 15–20% drop in total search interest across used car terms, particularly visible in Q4.
- 02
Q1–Q2 2025
Search demand remained subdued
Terms like “used cars” and “cars for sale” hit multi-year lows by May 2025.
- 03
Q3 2025
A clear rebound emerged
In August 2025, “cars for sale” spiked to 112,000 searches, its highest volume since January 2023. “Used cars near me” and “used cars” also saw meaningful month-on-month gains.
Average monthly UK searches in 2025 explicitly related to “used cars”
Keywords containing “used” only · page 19“Cars for sale” searches in August 2025, its highest volume since January 2023
Page 18Year-on-year rise in ‘used cars’ search demand in August 2025
Page 05Page 19
Search Trend Highlights
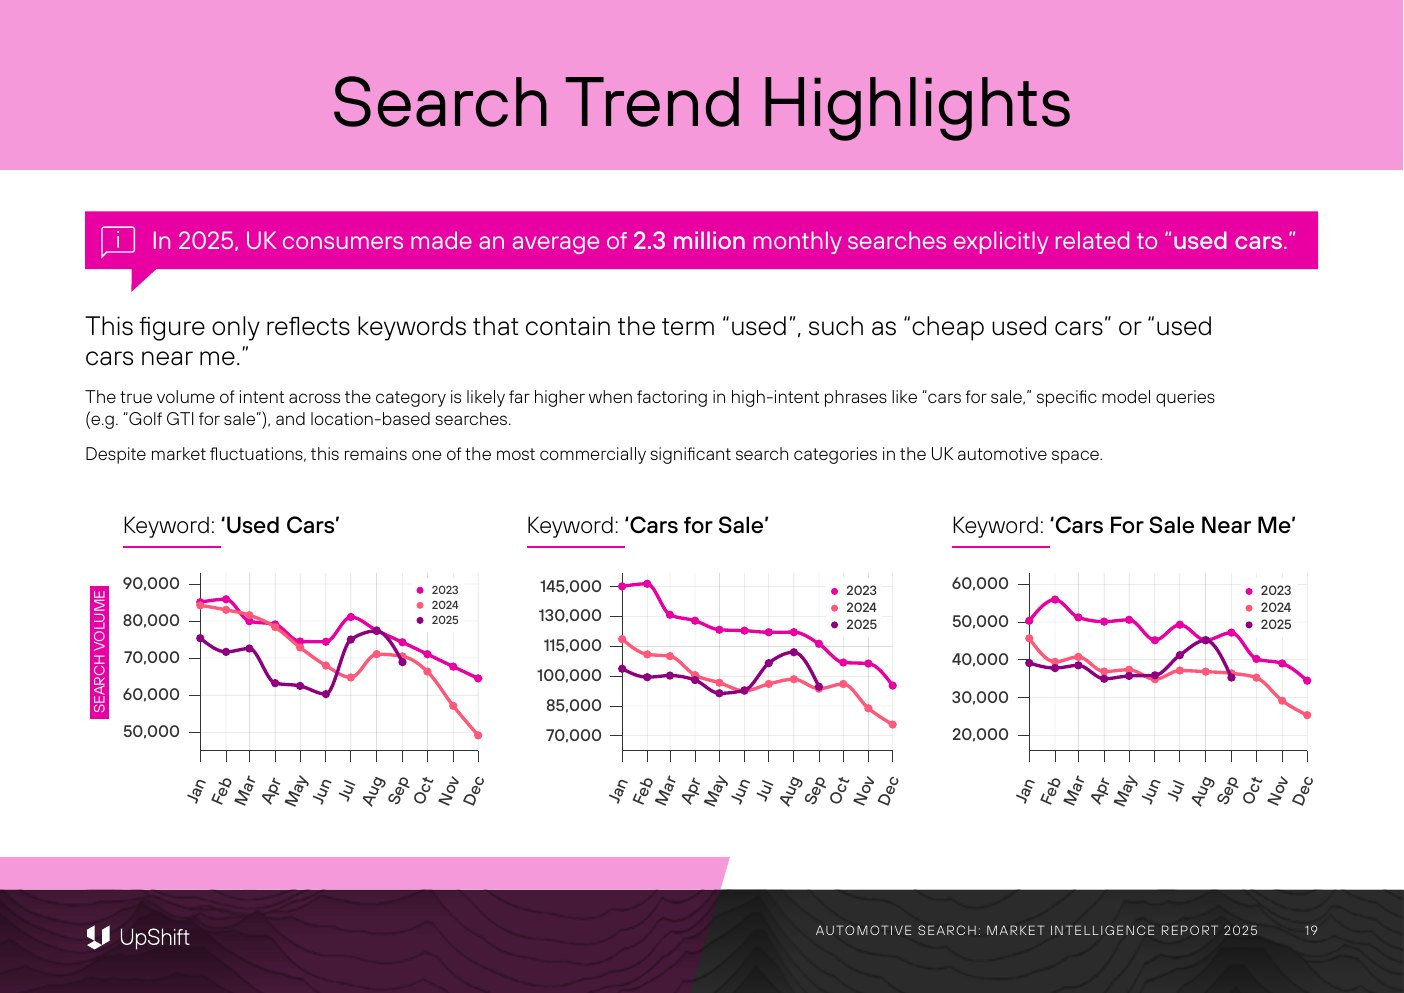
In 2025, UK consumers made an average of 2.3 million monthly searches explicitly related to “used cars.” This figure only reflects keywords that contain the term “used”, such as “cheap used cars” or “used cars near me.”
The true volume of intent across the category is likely far higher when factoring in high-intent phrases like “cars for sale,” specific model queries (e.g. “Golf GTI for sale”), and location-based searches.
Despite market fluctuations, this remains one of the most commercially significant search categories in the UK automotive space.
Authoritative source visual · page 19
Used Cars Search Trends
Structured evidence
Who’s Winning the Traffic?
| Rank | Domain | Type | Sept 2025 | Sept 2024 | YoY |
|---|---|---|---|---|---|
| 1 | AUTOTRADER.CO.UK | Marketplace | 14,300,000 | 12,100,000 | 18% |
| 2 | CARWOW.CO.UK | Aggregator | 1,900,000 | 2,000,000 | -5% |
| 3 | MOTORS.CO.UK | Marketplace | 1,610,000 | 1,450,000 | 11% |
| 4 | ARNOLDCLARK.COM | Dealer group | 1,222,000 | 1,309,000 | -7% |
| 5 | EVANSHALSHAW.COM | Dealer group | 963,000 | 788,000 | 22% |
| 6 | PARKERS.CO.UK | Reviews & advice | 846,000 | 1,000,000 | -15% |
| 7 | WEBUYANYCAR.COM | C2B | 841,000 | 829,000 | 1% |
| 8 | CINCH.CO.UK | Online retailer | 685,000 | 518,000 | 32% |
| 9 | LOOKERS.CO.UK | Dealer group | 494,000 | 419,000 | 18% |
| 10 | BRISTOLSTREET.CO.UK & VERTUMOTORS.COM | Retail group | 434,000 | 400,000 | 9% |
| 11 | CARGURUS.CO.UK | International | 339,000 | 873,000 | -61% |
| 12 | USEDCARSNI.COM | Regional | 327,000 | 324,000 | 1% |
| 13 | MOTORWAY.CO.UK | C2B platform | 325,000 | 313,000 | 4% |
| 14 | MARSHALL.CO.UK | Retail group | 220,000 | 124,000 | 77% |
| 15 | STONEACRE.CO.UK | Retail group | 196,000 | 217,000 | -10% |
| 16 | CAZOO.CO.UK | Online retailer | 131,000 | 389,000 | -66% |
| 17 | CARSHOP.CO.UK | Retailer | 79,000 | 73,000 | 8% |
| 18 | EXCHANGEANDMART.CO.UK | Classifieds | 59,000 | 68,000 | -13% |
| 19 | HEYCAR.CO.UK | Retailer | 55,000 | 69,000 | -20% |
Page 21
What’s Driving It?
Several converging forces are behind these search shifts:
Economic Headwinds (2023–2024)
High interest rates and declining real wages suppressed both purchasing and financing. Many consumers simply stayed out of the market, not for lack of interest, but affordability.
Market Correction
Used car prices peaked in 2022, but by mid-2024 had settled around £16,700, staying stable through 2025. Older vehicles (10+ years) grew in popularity, as consumers sought value, with prices for these models rising by 4.1% YoY in mid-2025.
Supply-Side Improvements
Stock levels began to recover in early 2025 due to increased fleet turnover and part-exchange vehicles re-entering the market. This gave dealers more to list and consumers more reason to search.
Interest Rate Cuts
The Bank of England’s rate cut in May 2025 (to 4.25%), followed by another in August (to 4.0%), made car finance more affordable, particularly for used stock. These moves correspond directly to the observed lift in search volume in July and August 2025.
TLDR
Strategic Implications for used cars
- 01Get to intent earlier
Search journeys around used cars aren’t linear and they’re getting shorter. Many consumers move from initial browsing to “cars for sale near me” in the same session. If you’re only visible at the last click, you’re late.
- 02Index your stock properly, or get buried
Used car visibility is now being driven by structured data, localised pages, and inventory freshness. Auto Trader and Motors still dominate, but dealer groups like Marshall and Lookers are outperforming with smart tech and disciplined SEO.
- 03Speak to the “value mindset”
With average prices stabilising around £16.7k, affordability is still the deciding factor. High-growth sites are leaning into “best under £Xk” modifiers, surfacing reassurance content (MOT history, warranties, financing pre-checks), and building comparison tools, not just stock listings.
- 04Don’t bet everything on marketplaces
While Auto Trader remains top of the pile, brands like Cinch and Motorway have proven that focused positioning + performance clarity can drive meaningful visibility gains. There’s space to play, especially if you’re building trust through content and transparency.
- 05Make search your lead indicator
Search is often treated as a conversion channel, but it’s more than that. It’s the clearest window into demand reactivation. The recovery isn’t being declared in boardrooms, it’s playing out in 2.3 million search queries a month.
New Cars
Market Context
New Cars · Page 23
New Cars: Market Context
The UK new car market has shown cautious but consistent growth across 2025. As of August, registrations were up +2.4% year-to-date, on course to hit 1.9 million vehicles by year-end, the strongest post-pandemic figure to date (SMMT, 2025).
New entrants, particularly from China, have also shaken the category. BYD’s registrations grew 654% YoY in April, while Jaecoo, virtually unknown a year ago, now holds more than 11,000 UK sales YTD.
New car registrations year-to-date as of August 2025, on course for 1.9 million by year-end
SMMT, 2025EV share of the market in August 2025, the highest this year
SMMT, 2025BYD registrations year-on-year in April; Jaecoo holds more than 11,000 UK sales YTD
Page 23Page 23
The category’s recovery has been shaped by three primary forces
Fleet sales have returned in volume
Driven by pent-up demand and corporate fleet renewals.
Private buyers remain price-sensitive
With rising finance costs and ongoing EV confusion softening household-level interest.
EVs and PHEVs are surging in share
Even as overall demand fluctuates month to month. In August 2025, EVs hit 26.5% of market share, the highest this year.
Page 24
Search Trend Highlights
Unlike the used car market, where terms like “used cars” or “cars for sale” provide clean signals of demand, the new car category resists broad-brush analysis.
That’s because consumers rarely search for “new cars” in isolation. Instead, their discovery journey almost always begins with a specific brand, model, or use case in mind.
To understand what’s really happening, we focused on the primary brand keyword for each of the UK’s top manufacturers. This approach gives us two key insights:
How many people are actively thinking about that brand
Whether they’re potential buyers, existing customers, or general engagers. While not all searches reflect purchase intent, brand keyword volume remains a useful proxy for UK brand salience.
How effectively each brand converts that interest
By analysing what proportion of users actually click, and whether those clicks are won organically or through paid ads.
Authoritative source visual · page 25
Brand Search Performance
Tesla monthly searches, up +7% YoY, with a 63% organic-only click share
Page 25BYD brand search growth YoY, with 68% of clicks going to organic listings
Page 25Jaecoo brand search growth YoY; its primary brand keyword now averages over 20,000 searches/month
Page 25Page 25
The results are telling
Brand Volume & Visibility Shifts
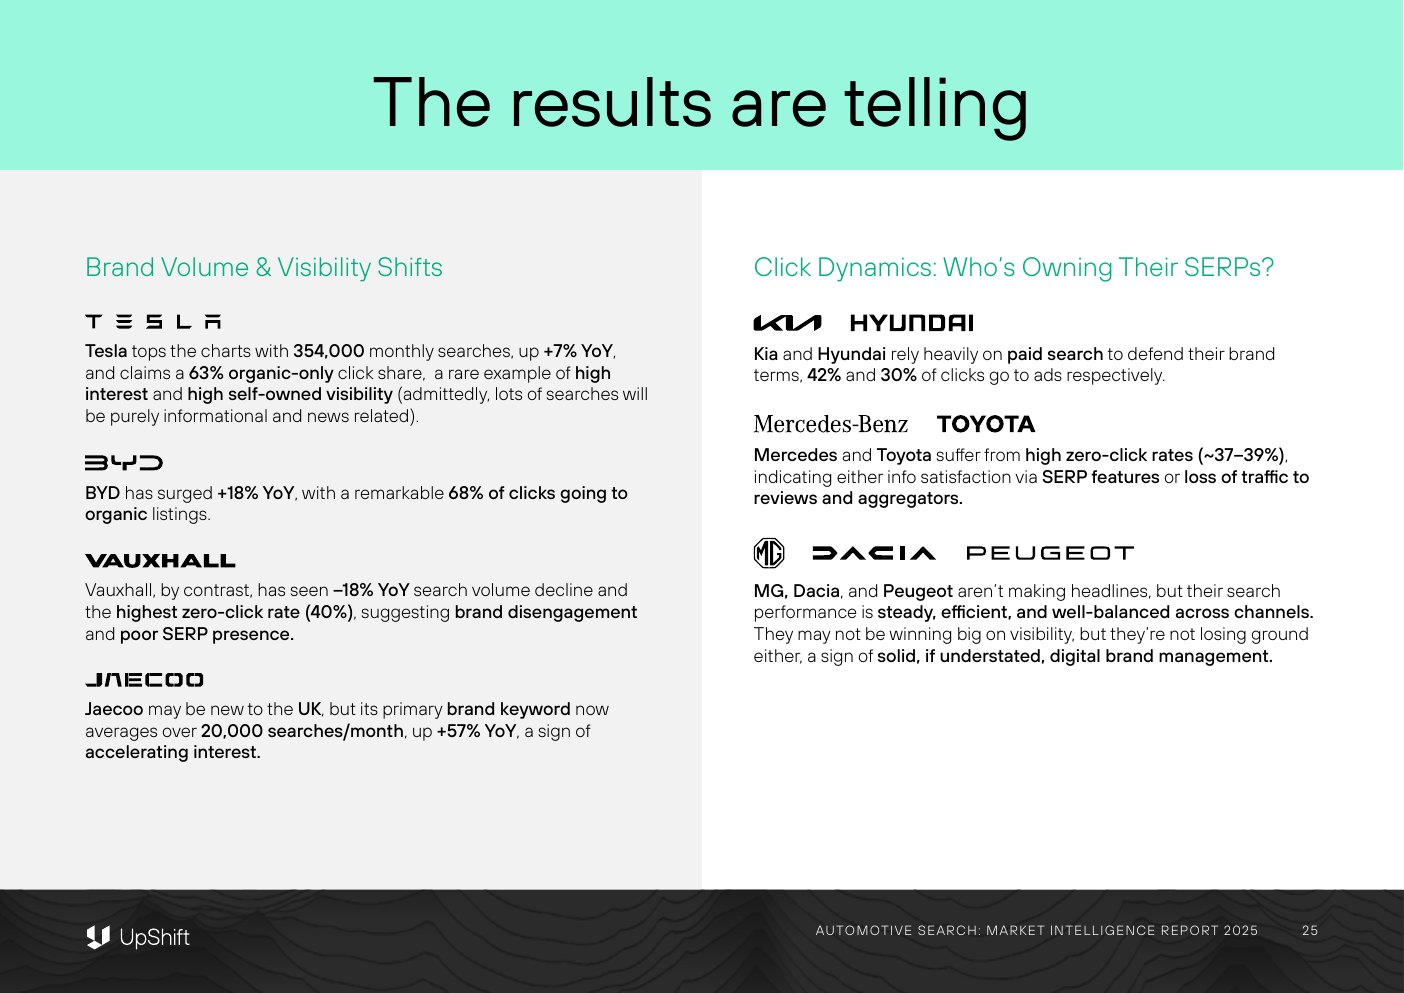
- Tesla tops the charts with 354,000 monthly searches, up +7% YoY, and claims a 63% organic-only click share, a rare example of high interest and high self-owned visibility (admittedly, lots of searches will be purely informational and news related).
- BYD has surged +18% YoY, with a remarkable 68% of clicks going to organic listings.
- Vauxhall, by contrast, has seen –18% YoY search volume decline and the highest zero-click rate (40%), suggesting brand disengagement and poor SERP presence.
- Jaecoo may be new to the UK, but its primary brand keyword now averages over 20,000 searches/month, up +57% YoY, a sign of accelerating interest.
Click Dynamics: Who’s Owning Their SERPs?
- Kia and Hyundai rely heavily on paid search to defend their brand terms, 42% and 30% of clicks go to ads respectively.
- Mercedes and Toyota suffer from high zero-click rates (~37–39%), indicating either info satisfaction via SERP features or loss of traffic to reviews and aggregators.
- MG, Dacia, and Peugeot aren’t making headlines, but their search performance is steady, efficient, and well-balanced across channels. They may not be winning big on visibility, but they’re not losing ground either, a sign of solid, if understated, digital brand management.
New Cars
What’s Driving It?
The shifts in new car search behaviour are being shaped by multiple overlapping forces:
Discovery Is Still Brand-First
Brand searches dominate the new car space, but loyalty is weakening. Emerging OEMs are pulling attention away from traditional market leaders, often before the shortlist even forms. BYD, MG, and Jaecoo prove that price, product, and a strong digital footprint can rewire perception quickly.
Paid Search Is a Defence Mechanism
The rise in paid-only click shares suggests that many brands are forced to spend just to retain their own traffic. This may be due to poor organic optimisation, aggressive competitor bidding, or a lack of owned content surfacing for key queries.
Zero-Click Rates, The Invisible Fracture in Search
A rising share of brand searches are now not resulting in any clicks, a trend that can be traced directly to Google’s AI Overviews. These are generative AI summaries that appear at the top of the search results and satisfy user queries without requiring further clicks. What changed: introduced in the U.S. in May 2024 and rolled out to the UK by October 2024, AI Overviews now appear across 100+ countries.
Behaviour shift: since their introduction, zero-click searches surged, from 56% to 69% in certain domains. Why it matters: even iconic brand terms are vulnerable. A brand might be present on the page, but the AI Summary can answer the query so conclusively that no user visits a site, limiting conversion opportunity and diminishing direct engagement.
The race for rankings no longer ends at the top of the results page.
TLDR
What this Means for OEMs
- 01If your brand isn’t contributing to the narrative, someone else will
In the age of AI-generated answers, LLMs now synthesise content from across the web to deliver a single, authoritative response and if your brand isn’t contributing clearly to that narrative, someone else will.
- 02Withholding detail leaves a gap for others to fill
Brands that withhold key details like pricing, performance, or comparisons in favour of polished, curated messaging risk having that gap filled by forums, reviews, and third-party sources. Transparency and content completeness are now critical, not just for SEO, but to control how AI explains your brand to your audience.
- 03Appear in the answer layer, not just the SERP
Measuring visibility and intent via click metrics is less reliable: brands must pay attention to appear in the answer layer, not just the SERP.
- 04Content strategy must evolve
Instead of just optimising pages for ranking, OEMs need to craft high-quality, citation-ready content that stands a chance of being included in AI Overviews.
Page 28
A Note On Electric Vehicles
Electric Vehicles remain one of the most dynamic and debated areas in the automotive industry. From policy shifts and charging anxieties to brand repositioning and search intent fragmentation, the EV space is evolving rapidly. While we’ve touched on EV-specific search trends throughout this report, we believe the category deserves its own focused spotlight.
That’s why we’re preparing a standalone deep dive on The State of EV Search, exploring everything from second-hand EV demand to the role of LLMs in shaping EV discovery. Keep your eyes peeled.
Car Finance
Market Context
Car Finance
29Car Finance: Market Context
Car finance remains the dominant vehicle funding model in the UK and despite regulatory turbulence and economic pressure in recent years, the sector continues to show both resilience and relevance.
As of mid-2025, the total outstanding balance of consumer car finance agreements in the UK stands at approximately £86 billion, according to the Finance & Leasing Association (FLA). This makes it the second-largest form of consumer credit after mortgages and a critical enabler of both new and used vehicle purchases across the country.
Looking back over the last five years, the UK car finance sector has expanded steadily, with market analysts projecting continued growth through to 2030.
More than 80%, typically Personal Contract Purchase (PCP) or Hire Purchase (HP), with used car finance also becoming more prominent year-on-year. Source: Finance & Leasing Association.
Page 30
Market Context (cont.)
The past two years have not been without disruption. 2023 and early 2024 were shaped by elevated interest rates, rising vehicle prices, and regulatory scrutiny, particularly surrounding historic commission-based finance deals. At one point, estimated compensation liabilities relating to these practices were projected to exceed £30 billion, before being revised downward following a Supreme Court ruling in mid-2025.
Nonetheless, the finance market has bounced back strongly in 2025.
Used vehicle finance has played a growing role in this recovery. With a wider spread of price points and flexible deal structures, the used sector has slightly outpaced new car finance volumes so far in 2025, aided by strong demand in the £10k–£15k price bracket and increased buyer caution.
New car finance lending in March 2025, the highest monthly total since early 2022
Page 30Growth in the value of new finance business across H1 2025 year-on-year, with more than 1.1 million cars purchased on finance
Page 30Average consumer car finance rate by mid-2025, eased from 6.6% in 2024, helping restore affordability and unlock deferred demand
Page 30Authoritative source visual · page 31
Search Trend Highlights: Car Finance
Page 31
Search Trend Highlights
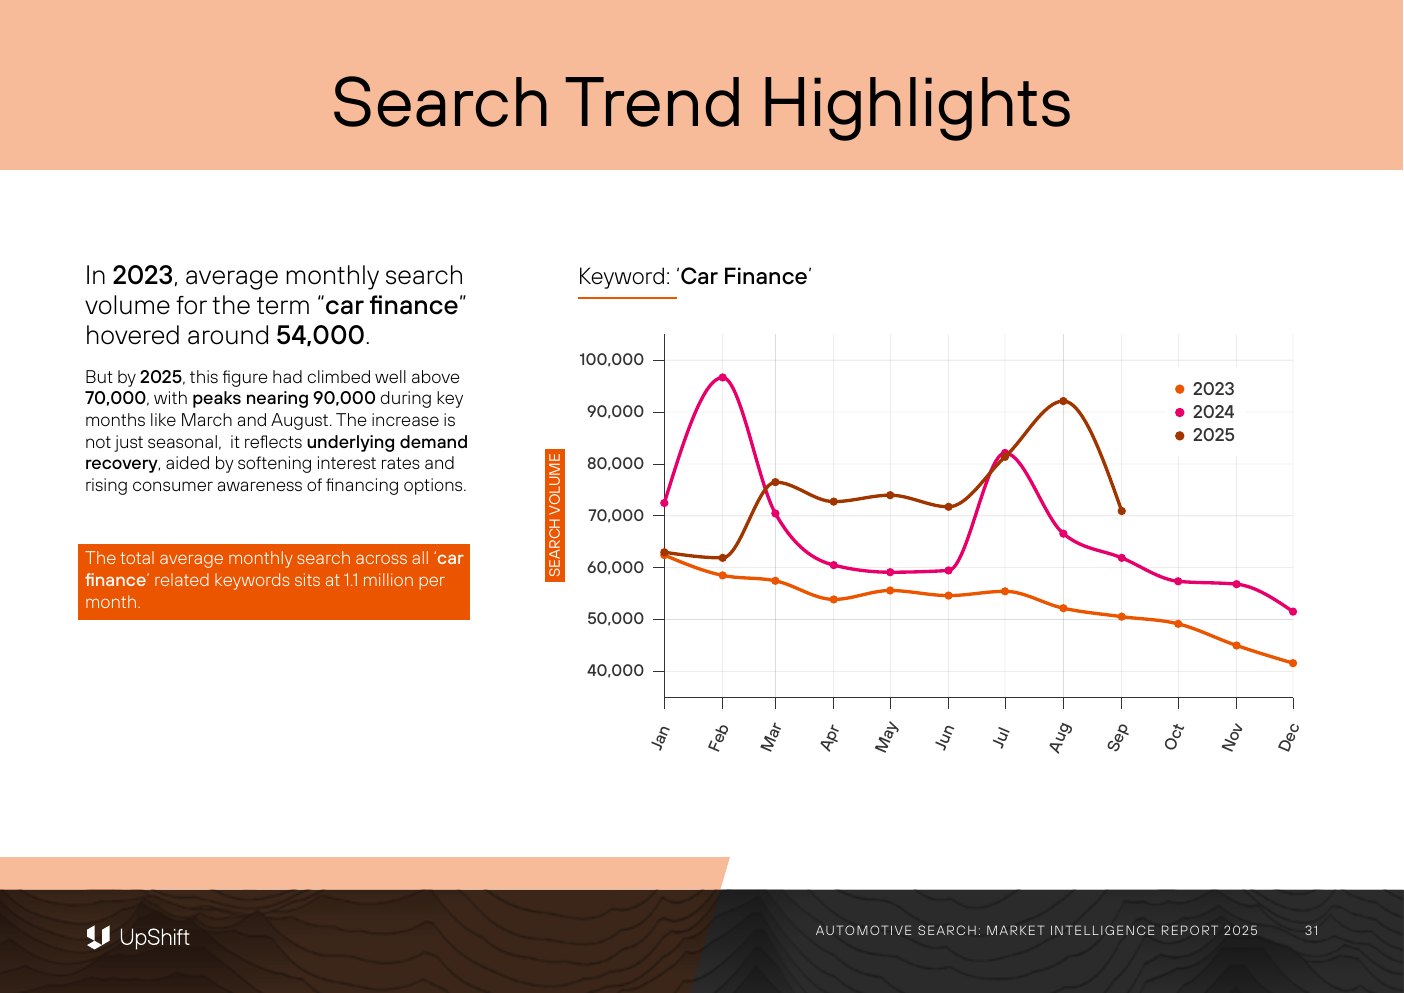
In 2023, average monthly search volume for the term “car finance” hovered around 54,000. But by 2025, this figure had climbed well above 70,000, with peaks nearing 90,000 during key months like March and August.
The increase is not just seasonal, it reflects underlying demand recovery, aided by softening interest rates and rising consumer awareness of financing options.
The total average monthly search across all ‘car finance’ related keywords sits at 1.1 million per month.
Authoritative source visual · page 32
PCP Shows Staying Power
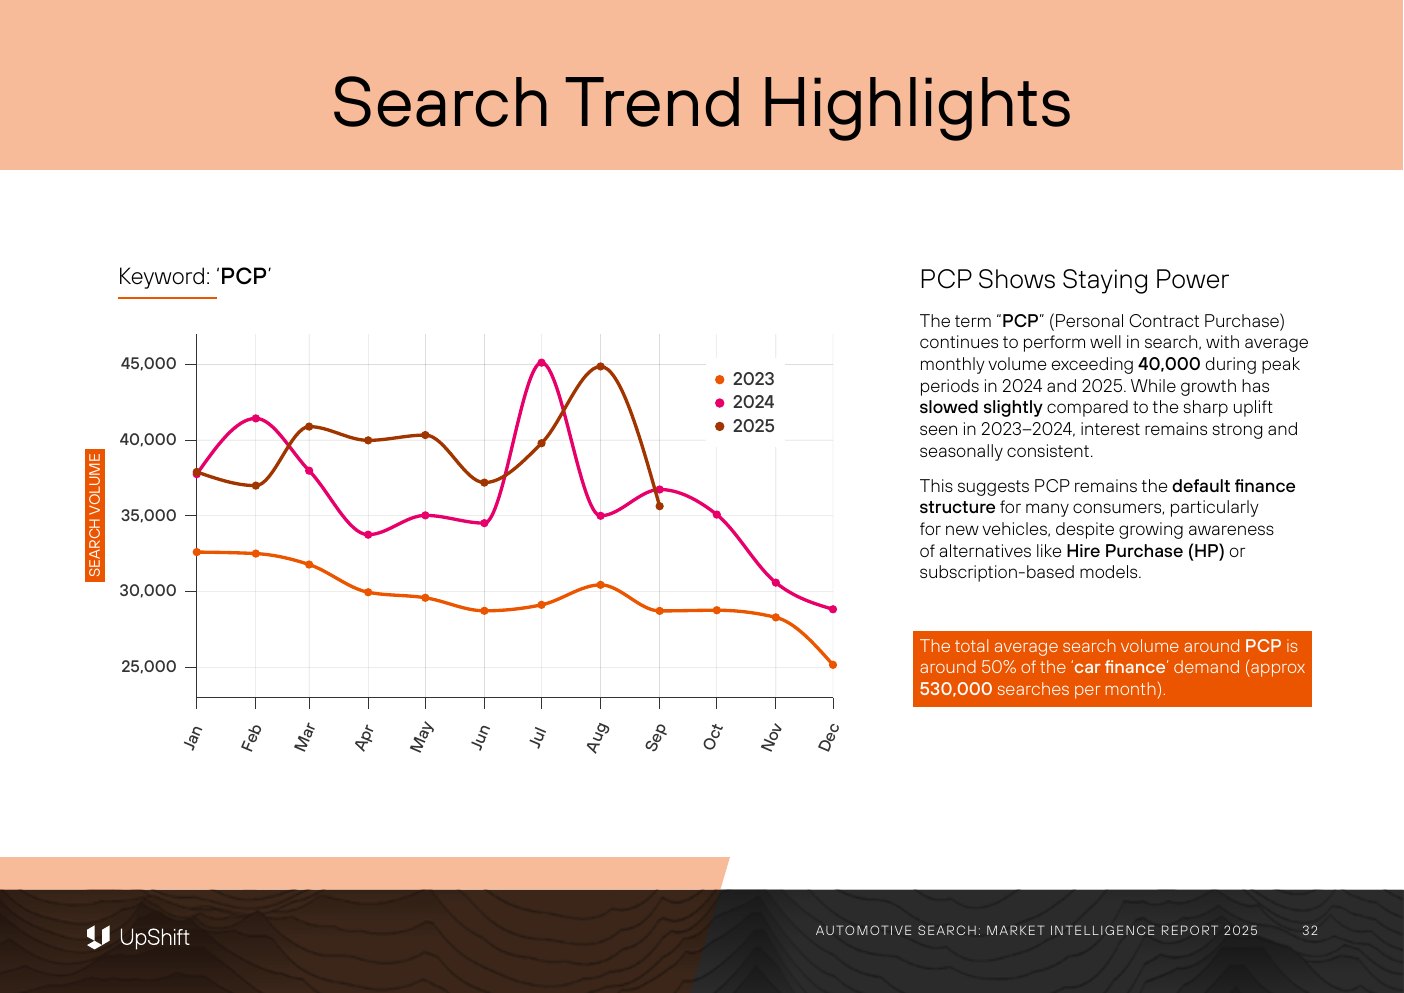
The total average search volume around PCP is around 50% of the ‘car finance’ demand (approx 530,000 searches per month).
Page 32
PCP Shows Staying Power
The term “PCP” (Personal Contract Purchase) continues to perform well in search, with average monthly volume exceeding 40,000 during peak periods in 2024 and 2025. While growth has slowed slightly compared to the sharp uplift seen in 2023–2024, interest remains strong and seasonally consistent.
This suggests PCP remains the default finance structure for many consumers, particularly for new vehicles, despite growing awareness of alternatives like Hire Purchase (HP) or subscription-based models.
Page 33
What’s Behind the Growth?
Several factors are likely contributing to the uptick in search demand:
Average interest rates easing
Car Finance deals falling from ~6.6% to ~5.4% over the past 12 months, making finance deals more accessible.
Cost-of-living pressures
As fewer buyers can afford to purchase outright, finance becomes a necessity, not a luxury.
Better digital journeys
Comparison tools, calculators, and eligibility checkers reduce friction and increase engagement.
Page 34
Who’s Winning the Traffic?
In July 2025, the month with the most reliable data, we analysed organic traffic across dedicated automotive car finance platforms.
This view deliberately focuses on auto-specific finance providers, excluding high-street banks, comparison sites, and multi-sector lenders who also compete for search traffic in this space. While those brands play a role in the broader market, this snapshot is designed to reflect performance within the automotive vertical itself, where search intent and commercial models are more directly comparable.
Structured evidence
Who’s Winning the Traffic?
| Domain | Est. total traffic | Direct | Organic | Paid | Other |
|---|---|---|---|---|---|
| CARFINANCE247.CO.UK | 500,000 | 50% | 26% | 14% | 10% |
| ZUTO.COM | 393,000 | 48% | 13% | 32% | 7% |
| CARMOOLA.CO.UK | 171,000 | 30% | 46% | 16% | 8% |
| CARPLUS.CO.UK | 106,000 | 28% | 56% | 12% | 4% |
| CARMONEY.CO.UK | 73,000 | 43% | 36% | 11% | 10% |
| MOTORFINITY.UK | 71,000 | 29% | 64% | 1% | 6% |
| MONEYBARN.COM | 56,000 | 43% | 48% | 4% | 5% |
| OODLECARFINANCE.COM | 45,000 | 37% | 15% | 45% | 3% |
| BLUEMOTORFINANCE.CO.UK | 38,000 | 66% | 29% | 0% | 5% |
| GOCARCREDIT.CO.UK | 25,000 | 38% | 57% | 0% | 5% |
| WEFINANCEANYCAR.COM | 22,000 | 18% | 39% | 38% | 5% |
Who’s Winning the Traffic?
CarFinance247 leads with ~500K monthly visits, followed by Zuto (~393K) and Carmoola (~171K). However, the distribution of traffic sources tells a more nuanced story.
Motorfinity, Go Car Credit, and Carplus each generate over 50% of their traffic from organic search. While this could suggest a degree of SEO strength, it may also simply reflect limited investment in other channels. Without broader context, such as content breadth, rankings, or competitive positioning, it’s best seen as an indicator of organic reliance, rather than a definitive marker of SEO maturity.
Zuto and Oodle lean heavily on paid acquisition, with 32 to 45% of traffic coming from ads.
Bluemoto and CarFinance247 see high direct traffic (50 to 66%), suggesting strong brand recall or repeat engagement. This could indicate a degree of investment in above-the-line activity. It’s worth noting that CarFinance247 have approximately doubled their organic traffic between January 2025 and July.
This points to a market where visibility strategies vary sharply and where SEO, PPC, and brand all compete for influence.
Car Leasing
Market Size & Role
Car Leasing · Page 36
Car Leasing: Market Size & Role
According to the British Vehicle Rental and Leasing Association (BVRLA), its members manage a leasing fleet of nearly 2 million vehicles, a figure that has grown 5% year-on-year as of early 2025.
This covers contract hire arrangements for both private drivers and businesses, as well as salary sacrifice schemes. Source: BVRLA Leasing Outlook Report – April 2025.
Vehicles on Business Contract Hire (BCH), which continues to lead the sector, up 6% year-on-year
BVRLA Leasing Outlook Report – April 2025Vehicles on Personal Contract Hire (PCH), down 13% year-on-year, reflecting reduced consumer affordability in the face of higher interest rates and squeezed disposable incomes
BVRLA Leasing Outlook Report – April 2025Year-on-year growth in salary sacrifice leasing, the sector’s standout success, with over 100,000 active agreements, largely driven by favourable tax treatment and EV adoption among company drivers and employees
BVRLA Leasing Outlook Report – April 2025Authoritative source visual · page 37
EV Momentum in Leasing
Page 37
EV Momentum in Leasing
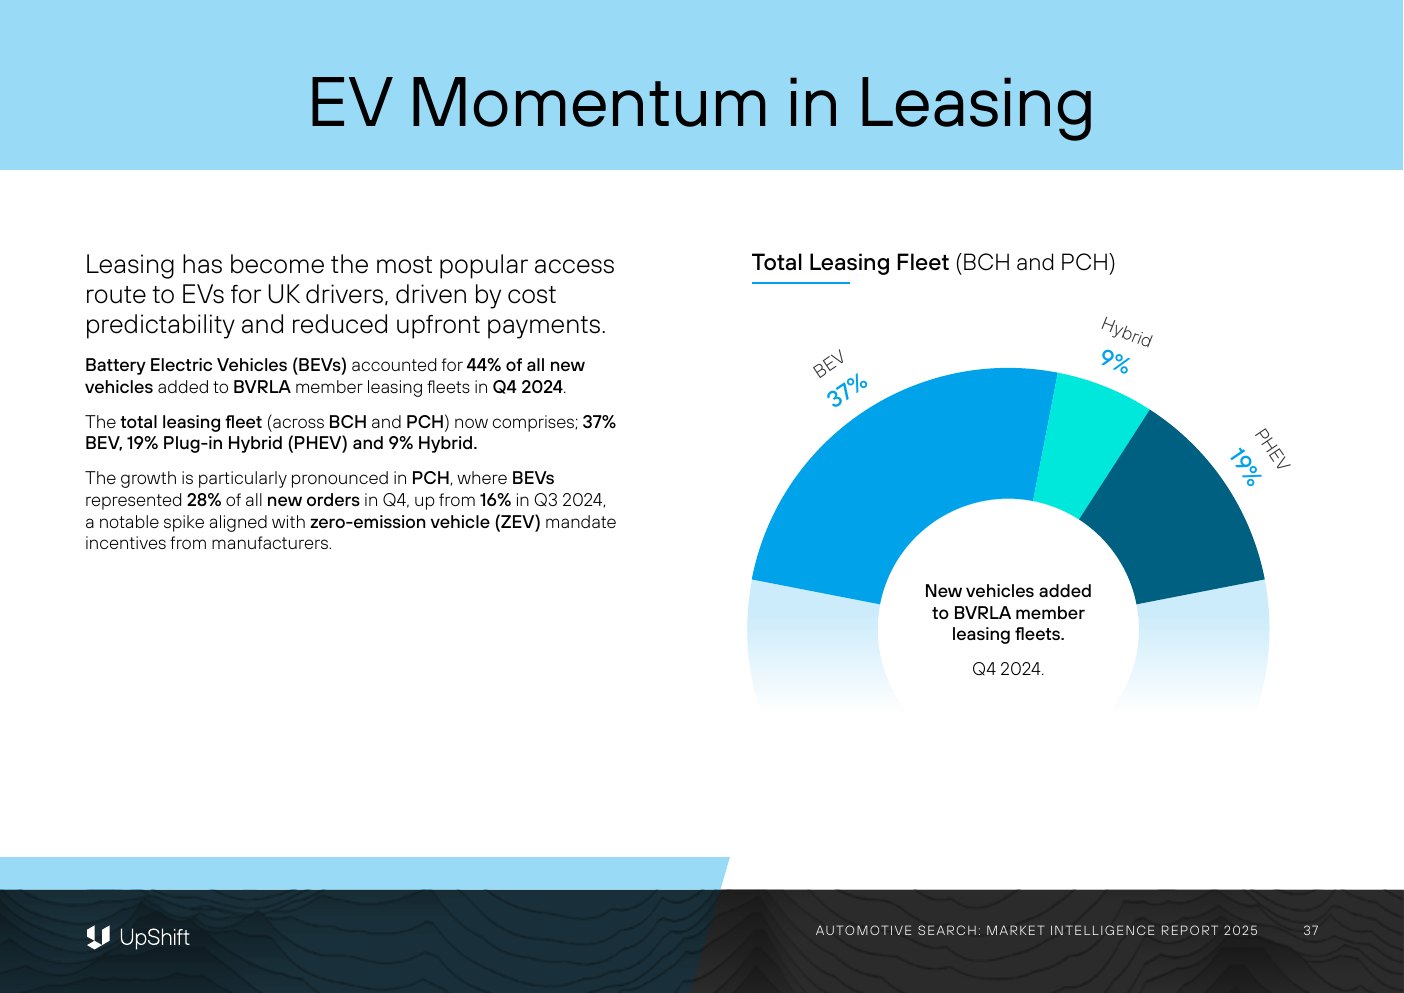
Leasing has become the most popular access route to EVs for UK drivers, driven by cost predictability and reduced upfront payments.
The growth is particularly pronounced in PCH, where BEVs represented 28% of all new orders in Q4, up from 16% in Q3 2024, a notable spike aligned with zero-emission vehicle (ZEV) mandate incentives from manufacturers.
New vehicles added to BVRLA member leasing fleets, Q4 2024.
Page 38
Strategic Challenges & Adaptations
While the business side of leasing remains resilient, the personal segment is feeling the strain. Key pressures include:
Affordability concerns
With UK interest rates only recently beginning to ease, PCH customers have become more cost-sensitive, often deferring renewals or shifting to used car finance models.
EV residual value uncertainty
Leasing providers remain cautious on pricing, as second-hand EV demand and values fluctuate.
Increased competition from OEM direct-to-consumer offerings
Increased competition from OEM direct-to-consumer offerings, such as subscription models and online leasing portals, is adding pressure on aggregators and brokers to differentiate.
Authoritative source visual · page 39
Search Trend Highlights: Car Leasing
Page 39
Search Trend Highlights
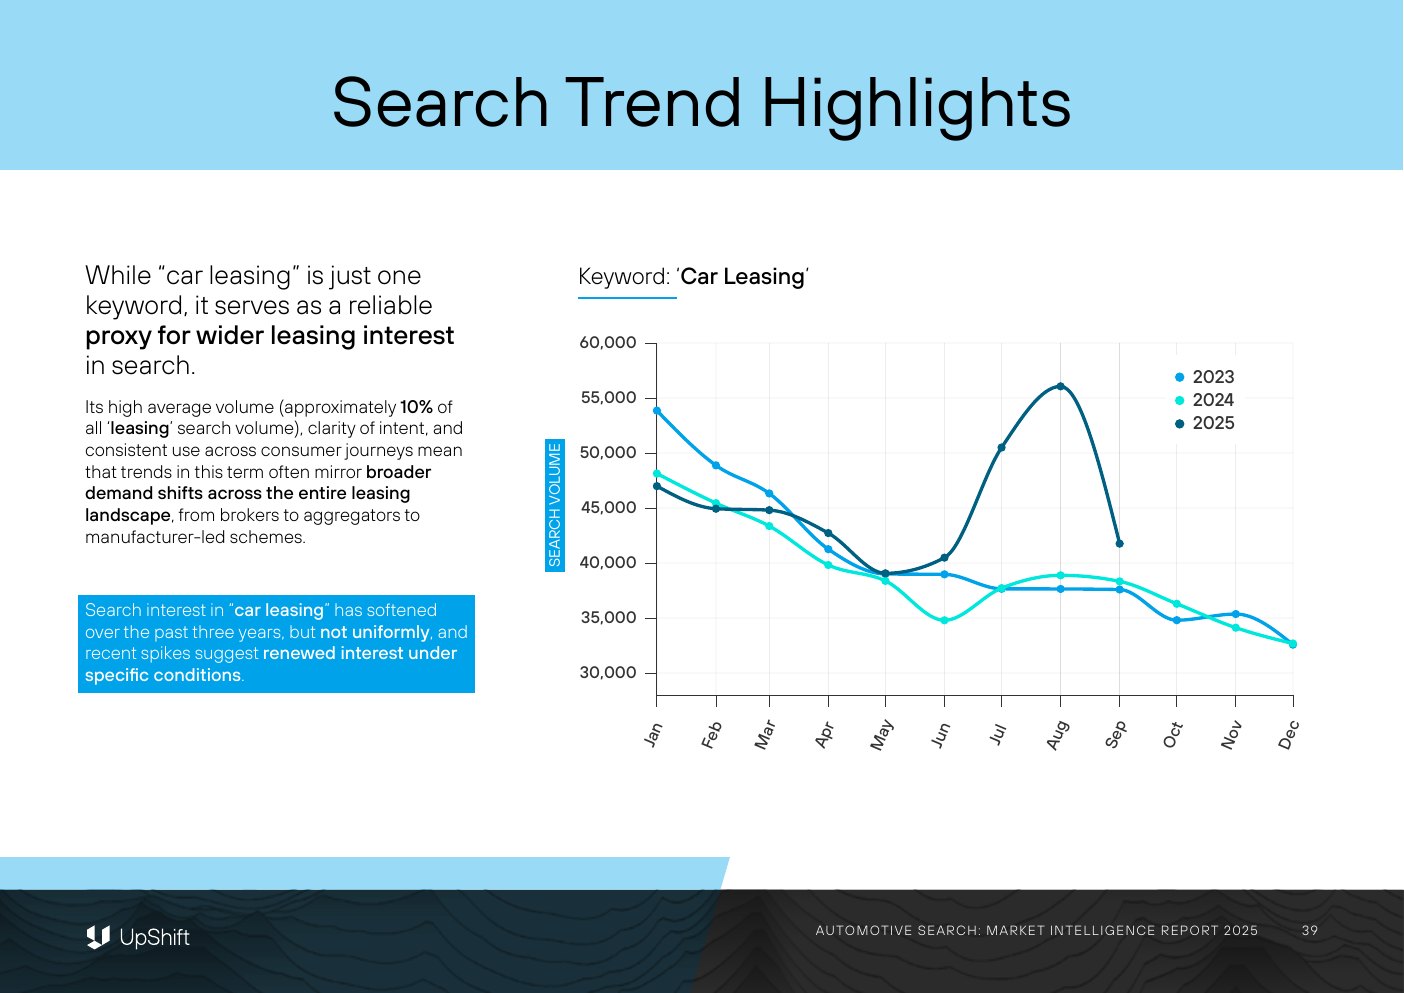
While “car leasing” is just one keyword, it serves as a reliable proxy for wider leasing interest in search. Its high average volume (approximately 10% of all ‘leasing’ search volume), clarity of intent, and consistent use across consumer journeys mean that trends in this term often mirror broader demand shifts across the entire leasing landscape, from brokers to aggregators to manufacturer-led schemes.
Search interest in “car leasing” has softened over the past three years, but not uniformly, and recent spikes suggest renewed interest under specific conditions.
Page 40 · Search Trend Highlights
A Gradual Downward Trend, then a Sudden Mid-2025 Recovery
Monthly search volume for “car leasing”, January 2023 to August 2025.
- 01
Jan 2023 – Jun 2024
A gradual downward trend
From January 2023 to June 2024, there’s a clear and steady decline in monthly search volumes, dropping from over 53,000 to a low of ~34,000. This aligns with broader market pressures: high inflation, elevated interest rates, and cost-of-living concerns made leasing less accessible or appealing to many consumers.
- 02
June 2024
The lowest point across all three years
Search interest fell to 34,787, down from 38,965 the year before.
- 03
Jul – Aug 2025
Sudden mid-2025 recovery
This trend reversed sharply in July and August 2025, with searches jumping to 50,493 and 56,057 respectively, the highest monthly volumes seen since early 2023. This mid-year surge may be attributed to:
- Interest rate cuts and improving consumer confidence.
- OEM-led EV lease campaigns ahead of the Zero Emission Vehicle (ZEV) mandate ramp-up.
- Growth in salary sacrifice schemes, which have become a mainstream leasing access point for EVs and hybrids.
- Increased content and ad spend from brokers and aggregators in Q3, creating uplift in brand and generic search terms.
Authoritative source visual · page 41
Aggregators SEO Efforts
Structured evidence
Channel Mix – Leasing Sector
| Domain | Sept. total traffic | Direct | Organic | Paid | Other |
|---|---|---|---|---|---|
| SELECT CAR LEASING | 800,000 | 37% | 50% | 9% | 4% |
| NATIONWIDE VEHICLE CONTRACTS | 320,000 | 35% | 47% | 13% | 5% |
| VANARAMA | 162,500 | 24% | 46% | 21% | 9% |
| HIPPO LEASING | 156,000 | 23% | 65% | 8% | 4% |
| LEASING OPTIONS | 90,000 | 37% | 48% | 5% | 10% |
| LEX AUTOLEASE | 87,000 | 65% | 32% | 0% | 3% |
| BRITANNIA CAR LEASING | 70,000 | 39% | 54% | 1% | 6% |
| SYNERGY CAR LEASING | 60,000 | 23% | 57% | 15% | 5% |
| PINK CAR LEASING | 55,000 | 45% | 8% | 35% | 12% |
| JURNI LEASING | 50,000 | 20% | 26% | 48% | 6% |
| LEASECAR.UK | 36,000 | 29% | 66% | 1% | 4% |
| GATEWAY2LEASE | 36,000 | 36% | 57% | 1% | 6% |
| CENTRAL UK VEHICLE LEASING | 26,000 | 41% | 31% | 10% | 18% |
| ALL CAR LEASING | 25,000 | 25% | 56% | 2% | 17% |
| RIVERVALE | 21,000 | 35% | 39% | 10% | 16% |
| EVANS HALSHAW LEASING | 16,500 | 18% | 70% | 6% | 6% |
| CAR LEASING MADE SIMPLE | 13,000 | 21% | 66% | 1% | 12% |
| FIRST VEHICLE LEASING | 17,000 | 26% | 60% | 7% | 7% |
| LEASING.COM | 844,000 | 38% | 37% | 17% | 8% |
| LEASELOCO | 920,000 | 35% | 26% | 24% | 15% |
Page 42
Organic search remains the cornerstone for most players
Across the leasing landscape, traffic acquisition strategies vary significantly but organic search remains the cornerstone for most players. Organic visibility is the dominant driver of performance, with many brands seeing 45–65% of traffic from search.
Platforms like LeaseCar.uk, Hippo Leasing, and Britannia Car Leasing rely heavily on SEO, indicating a well-established presence across key leasing-related terms and a long-term investment in discoverability.
Direct traffic also plays a significant role, particularly for brands like Lex Autolease, where 65% of visits arrive directly. This suggests strong brand recognition, likely fuelled by B2B contracts, long-term fleet relationships, or customer loyalty.
Page 43
Who’s Winning the Traffic?
Paid strategies are more varied and tactical
Brands like Pink Car Leasing and Jurni Leasing derive 35–48% of their traffic from paid, pointing to an aggressive growth push via PPC. Others, such as Gateway2Lease, Britannia, and Car Leasing Made Simple, operate with minimal paid input, reinforcing confidence in organic visibility and funnel strength.
Channel mix reveals strategic maturity
- Channel-reliant players (e.g. Jurni) are more exposed to paid performance fluctuations.
- Organically mature brands (e.g. LeaseCar.uk, Hippo) benefit from sustainable, lower-cost acquisition.
- Brand-led operators (e.g. Lex) win on reputation, relationships, and recall.
CPC Inflation Is Reshaping Paid Strategy
It’s also worth noting the significant CPC inflation across the leasing sector. Many high-intent keywords, particularly those tied to specific makes and models or location-based queries, have seen cost-per-click increases of up to 25% year-on-year. For brands relying heavily on paid traffic, this creates a mounting challenge: higher acquisition costs, fewer guaranteed returns, and increased competition for the most commercially valuable positions. For others, it’s reinforcing the importance of owning organic space, not just to improve visibility, but to defend margins.
There’s no one-size-fits-all approach in automotive leasing — but for most, owning the organic opportunity is still the foundation for long-term performance.
TLDR
What You Need To Know About The Direction Of Search As We Head Towards 2026
TLDR
Ten search priorities
AIO (AI + Human Optimisation)
Status: MATURING. Relevance to automotive: AIO content (e.g. finance guides, vehicle comparison pages) is increasingly used to scale long-tail targeting efficiently. Human-led prompts & editorial refinement are crucial for YMYL (Your Money Your Life) automotive finance content. Key watchout: AI content alone won’t rank for competitive finance keywords, E-E-A-T and editing are essential.
LLM Influence on Search (ChatGPT, Gemini, Perplexity, etc.)
Status: STRATEGIC. Relevance to automotive: consumers are now asking LLMs questions like “What’s the best car for under £20k with low insurance?” Brands need to ensure they’re being mentioned in the LLMs’ training data, Reddit, Quora, and aggregator content (Autotrader, WhatCar, etc.). Implication: SEO strategy now includes influencing the sources that shape LLM outputs, not just Google rankings.
GEO (Generative Engine Optimisation)
Status: EMERGING. Relevance to automotive: SEO teams are experimenting with optimising for AI Overviews and Search Generative Experience (SGE). Early visibility shows that Reddit, UGC, and expert-led sites (e.g. Parkers, Honest John) are rewarded. Next move: structure content for clarity, authority, and real-world experience, and track AI Overview placements (tools emerging).
Vehicle Ads on Google (VMLs)
Status: HIGH-PRIORITY FOR PAID. Relevance to automotive: Vehicle Listing Ads (VLAs) are expanding fast, especially in the US but increasingly rolling out in the UK. Dealers, aggregators, and marketplaces are fighting for dominance in this rich listing format. KPI shift: it’s not just about clicks anymore; inventory feed health, local targeting, and real-time pricing data are key.
Zero-Click SERPs & AI Overviews
Status: GROWING CONCERN. Relevance to automotive: a rising % of searches (esp. generic ones like “car finance”) result in no site clicks, traffic cannibalised by AI Overviews or featured snippets. OEMs and retailers must rethink attribution, “brand first” visibility matters more than ever. Tactic: push users to branded queries where click-through rates are higher.
Local Search Consolidation & Maps Domination
Status: CRITICAL FOR DEALERS. Relevance to automotive: GMB (Google Business Profiles) are more influential, with local pack driving walk-ins and phone calls. Google’s map layer increasingly appears in intent-rich searches like “used BMW near me” or “dealership finance”. Action: fully optimise dealer profiles & localised landing pages for major brand terms.
GA4 Confusion & Attribution Chaos
Status: FRUSTRATING. Relevance to automotive: attribution for multi-channel, multi-device journeys is messier than ever, especially for high-stakes products like cars or finance. GA4 doesn’t play well with dealer networks, finance partner handoffs, or offline test drives. Next move: brands must shift toward MMM (Marketing Mix Modelling) or incrementality testing, even in paid search.
YouTube Search & Shorts for Auto Discovery
Status: GROWING FAST. Relevance to automotive: users are searching on YouTube: “Best small SUV 2025,” “EV for new drivers,” “car finance explained.” YouTube Shorts (and TikTok) influence early consideration, even among older buyers now. Strategy tip: treat YouTube SEO and video content as part of your broader search visibility plan.
Schema & Structured Data Arms Race
Status: UNDERUTILISED. Relevance to automotive: schema for vehicle listings, reviews, finance calculators, and FAQs can dramatically boost visibility in AI and Google. Many finance pages are missing LoanOrCredit schema, which may become more important in AI answers. Key watchout: if your competitors implement schema better than you, they won’t just outrank you, they may become the only result users see.
The Rise of Aggregator Dominance
Status: STRATEGIC. Relevance to automotive: Google favours big aggregators (Carwow, Autotrader, Leasing.com) in top slots for many core terms. Even for branded queries, you’ll often find multiple comparison sites ahead of the OEM or dealer. Implication: brands need a dual approach: defend core brand search & integrate with aggregator strategies.
Struggling with declining performance, rising CPCs, or unclear strategy?
We can help!
enquiries@upshift.co.uk